Home
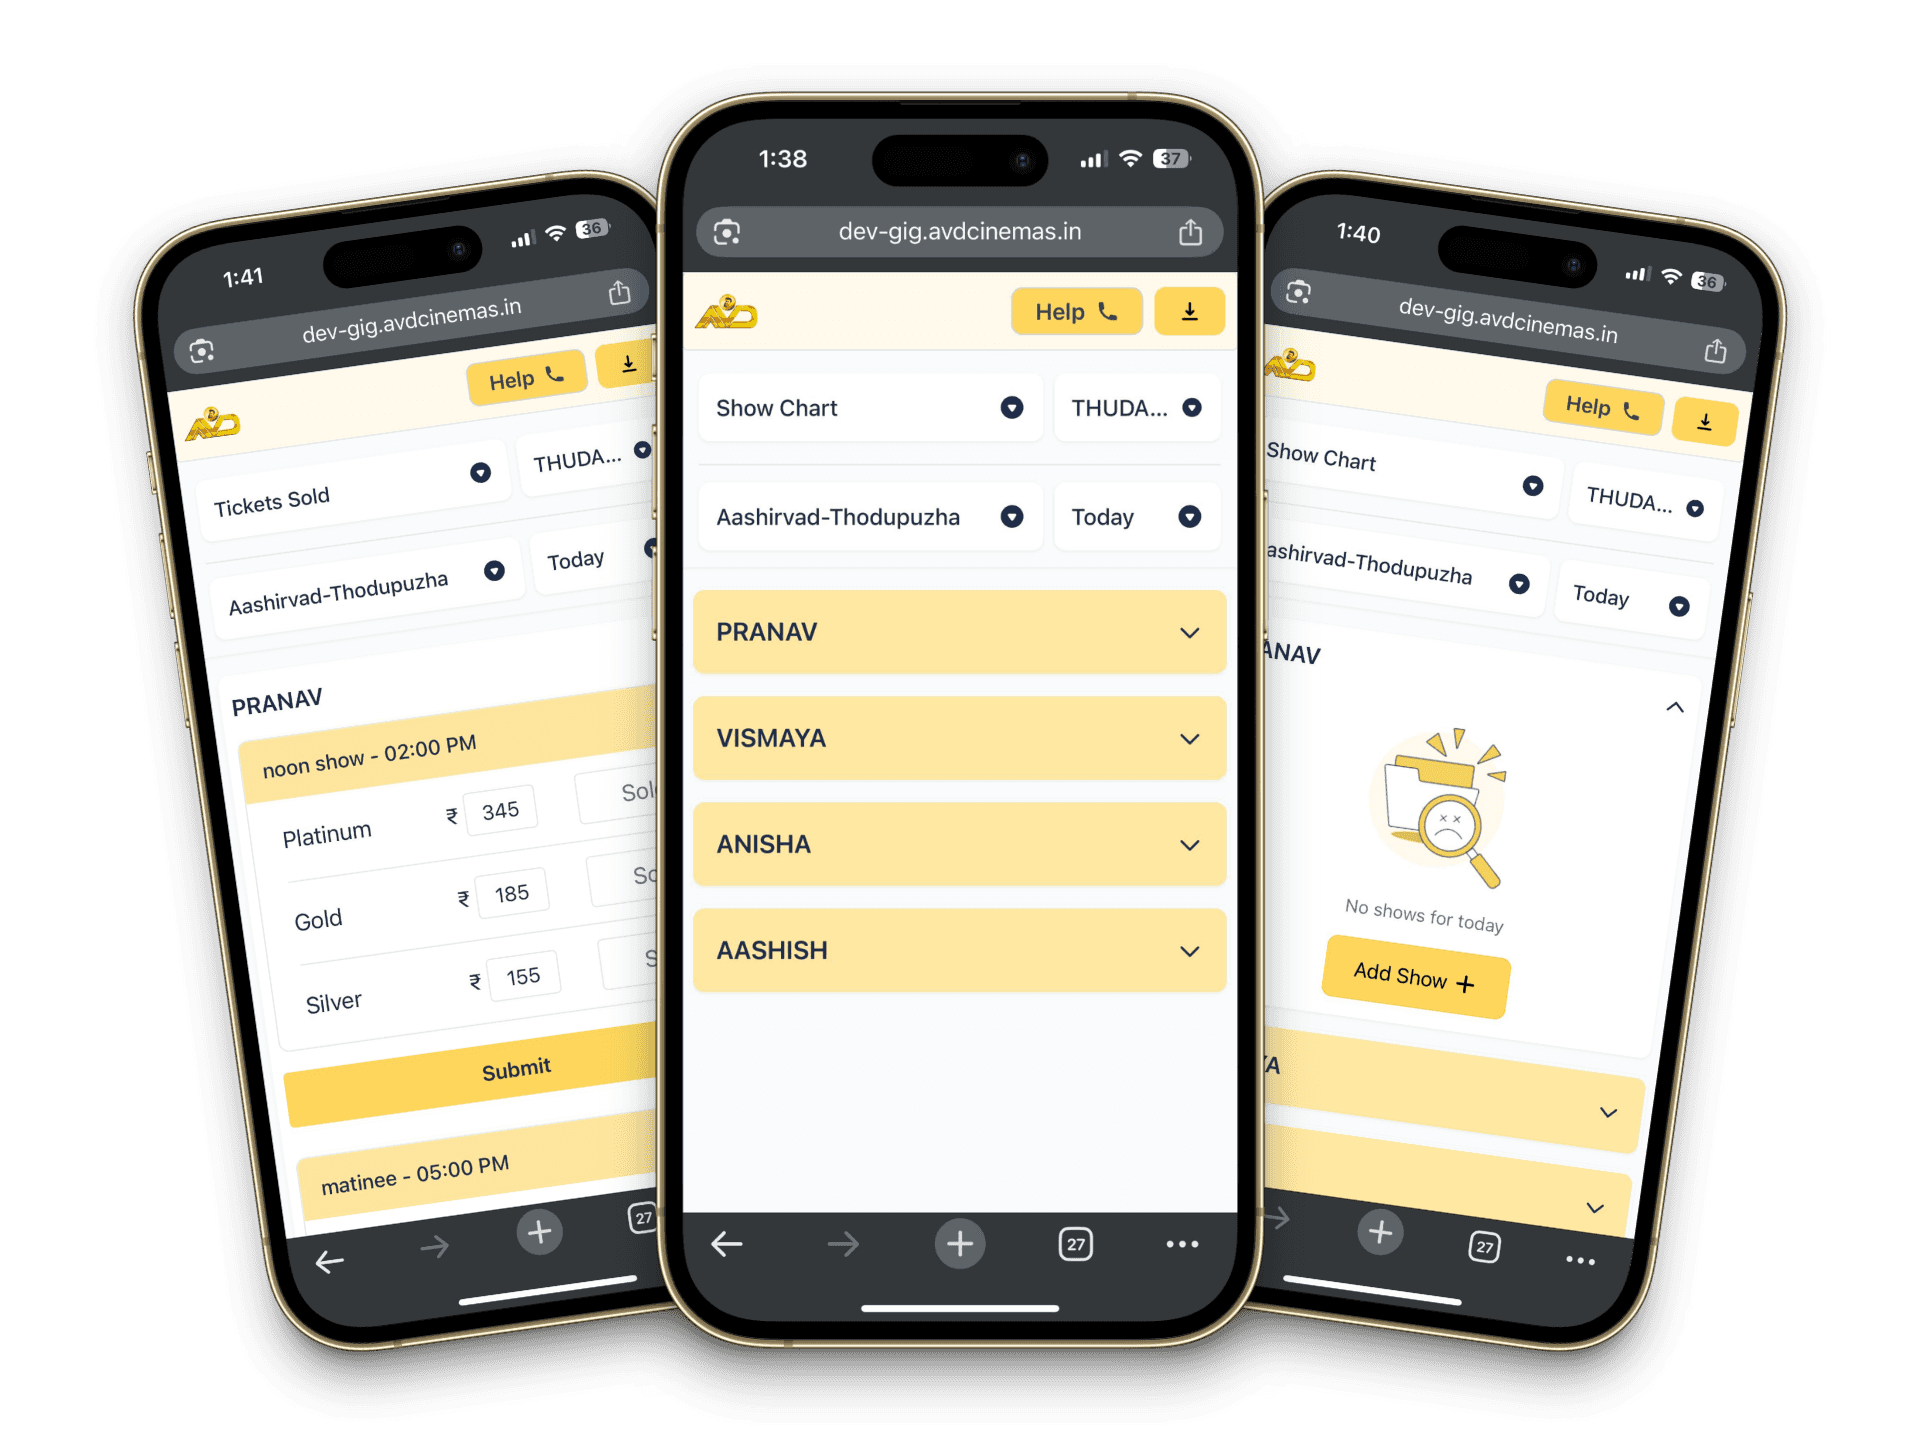
Digitizing
Box Office
Reporting
For Aashirvad CInemas
ROLE
UI UX Designer
TIMELINE
4 months
Jan-May 2025
SKILLS
Product Design
Systems Thinking
Prototyping
SUMMARY
Aashirvad Cinemas, a regional film distributor in Kerala, relied on manual reporting from their field reps during movie releases. An earlier MVP had tried to digitize this process but failed due to poor alignment with real-world workflows.
During my internship at the studio, I worked on rethinking this system from the ground up. Through system mapping, critiquing the existing MVP, wireframing, and live testing during actual movie releases, we developed a more intuitive, task-aligned tool. Continuous feedback from field reps and managers directly shaped the final design.
CONTEXT
Aashirvad Cinemas is a major film production and distribution company based in Kerala. In addition to producing films, Aashirvad also oversees the release of movies across more than 300 theatres, relying on a network of field representatives to collect and report ticket sales data.
Currently, this data collection workflow is largely manual and informal, reps typically communicate sales figures through WhatsApp messages or phone calls to their managers. This unstructured process creates several challenges, including lack of accuracy, poor data traceability, limited real-time access, and difficulty maintaining historical records.

UNDERSTANDING THE SYSTEM
To design an effective intervention for Aashirvad Cinemas’ distribution workflow, it was essential to first develop a clear understanding of how the system operates on the ground.
Their distribution network is divided into three primary regions, Ernakulam, Kozhikode, and Trivandrum, each managed by a Regional Manager who reports to the General Manager. Beneath them are the field representatives (reps), each assigned to specific theatres (sometimes more than one). Their primary task is to physically visit theatres and collect daily ticket sales and show data.
The distribution process begins when a movie is handed over by the producers to the distribution company, in this case, Aashirvad Cinemas, which then negotiates profit-sharing percentages with each theatre. Based on this agreement, daily collections are reported, and revenues are settled.
While the General Manager doesn't monitor every transaction, they often use intuition and experience to flag anomalies, for instance, if a theatre reports unusually low numbers for a popular film. However, these checks are not backed by a structured system of cross-verification, leading to gaps in accountability. Many inconsistencies go unnoticed unless they are glaringly obvious.
This reliance on manual judgement, informal communication channels, and lack of a unified digital system underlines the need for a more reliable, data-driven oversight mechanism.
REPRESENTATIVES KEY TASKS
Our taregt audience, the field representatives at Aashirvad, carry out several key tasks throughout a movie's release cycle, each of which plays a crucial role in data collection and revenue tracking.
Morning - Show Charting
> Visit assigned theatres to collect show schedules
> Note number of shows, timings, and screen allocations
> Share show details with the distribution team
> Sets the base for tracking the day’s performance
Throughout the Day - Ticket Tracking
> Return to theatres after each show to collect ticket sales data.
> Record tickets sold by seat category (balcony, premium, general, etc.)
> Manage tight schedules, especially when covering multiple theatres
End of Day - Day Close & DCR Submission
> Fill out the Daily Collection Report (DCR)
> Summarize total tickets sold and gross revenue
> Record the theatre–distributor revenue split
> Include rep’s BATA (daily allowance) details
> Final submission marks official close of daily reporting
⚠️ Workflow Challenges
• Reps often juggle multiple theatres and time-sensitive tasks.
• Many are older and familiar with smartphones for communication (e.g., WhatsApp) but not structured app-based systems.
• Their routines are informal, fast paced and unpredictable, with late night follow ups and mid day adjustments.
Any digital solution must respect this organic, real world workflow. If a tool is too rigid or unintuitive, it risks being abandoned, as was the case with the earlier failed MVP.
🚫 Why “Automation” Wasn’t the Answer
At first glance, it may seem logical to bypass field reps entirely and have theatres report data directly to Aashirvad through an automated platform. But in reality, this approach isn’t viable. Field representatives are backed by a strong regional labor union that protects their roles in the distribution process. Any attempt to remove or replace them with technology would meet significant resistance.
The design challenge, therefore, wasn’t to replace reps, it was to build a digital tool that works with them, enhancing their workflow without disrupting their role or pace.

PAIN POINTS OF PREVIOUS MVP
Before the redesign began, the studio I interned with had already developed a first MVP to digitize Aashirvad’s reporting process. It aimed to replace the reps’ informal workflows (like WhatsApp and phone calls) with a structured reporting app. Despite working technically, the MVP failed in real world testing and was ultimately rolled back. The issue wasn’t functionality, but a mismatch with how reps actually work.

💡 What We Learned
The original MVP was designed from the outside in, based on assumptions, not embedded understanding. This realisation led us to rethink the system from scratch. We redefined the user flows to include show charting, ticket tracking, on the go editing, show management, and flexible day close options, all based on how reps actually work. Flexibility, adaptability, and realism became the design priorities.
IDEATION AND WIREFRAMING
After identifying the shortcomings of the initial MVP and mapping out the reps’ daily workflows, we realized the system needed more than just better UI, it needed a more collaborative and flexible structure.
👥 Recognizing the Operator Role
One of the most important insights from MVP testing was the emergence of the operator role, a
support team responsible for monitoring reps, verifying reports, and offering real-time assistance. Although informal during the first rollout, we understood this role would be critical for long-term success.
This led us to design a parallel dashboard for operators, enabling oversight without micromanagement.
📊 Mapping the Core Workflow
To understand the interaction between reps and operators, we mapped the system at an event level, rather than screen-by-screen. The core flow looked like this:
1. Show Chartning (rep)
2. Charting Checkpoint (operator)
3. Ticket Entry (rep)
4. Entry Checkpoint (operator)
5. Day Close Submission (rep)
6. Final Checkpoint (operator)
This helped us frame the interdependence between them, especially on high-pressure release days. Here I have provide an example of one of such event flows, show charting:

✏️Wireframing & Layout Exploration
I led multiple iterations of wireframes with three goals:
> Simplify navigation across all three core tasks (charting, entry, day close)
> Keep everything accessible from a single, scrollable screen (minimize clicks)
> Ensure the layout worked intuitively on mobile
We explored modular layouts with a fixedn outer frame and adaptive inner content, allowing task-specific views without constant page-switching.

FINAL UI
🧱 Building the Design System
To ensure consistency and scalability, I created a flexible design system that retained familiar visual cues from the previous MVP, helping returning users feel oriented. It included:
> Color palette, typography, iconography
> Button styles, interaction states
> Reusable components like dropdowns and form fields
This system became the foundation for the final UI.

🤝 Design Reviews & Collaboration
The final designs were refined through multiple review cycles with the CEO (who led workflow decisions) and the dev team. Their input helped align UX decisions with technical feasibility and rollout constraints.
1. Log In & Control Panel
> Phone number → OTP login
> Once verified, users land directly on Show Charting
> Persistent top header for task switching (no full-page reloads)


2. Show Charting
> First screen by default — addresses the biggest gap in the original MVP
> Select screen → Add shows with dropdown time selectors
> Easy editing with delete icons and confirmation popups
> Submits trigger success popups for feedback and trust-building

3. Ticket Sold
> Mirrors the previous MVP, which users liked
> Reps enter ticket counts and editable prices per seat category
> Pulled dynamically based on selected screen and showtimes
> Submissions are confirmed with consistent UI feedback

4. Day Close
> Final step to submit daily financials
> Input BATA, Distributor’s Share %, and Kerala Flood Cess (KFC)
> Submitting locks the data to preserve integrity
> Confirmation screen provides final reassurance

TESTING AND FEEDBACK
To validate the redesigned system, the app was tested during the live releases of two films:
🎬 Phase 1: Get Set Baby (Feb 2025)
> Reps used the app alongside manual methods to compare accuracy
> Initial days required hand-holding (calls, clarifications)
> Over time, support requests dropped significantly
> All three core tasks (charting, entry, day close) were completed successfully
Issue observed:
> Reps wanted a summary screen before closing the day
> Some skipped tasks → led to incomplete data
Solutions introduced:
> Validation pop-up to prevent early day close
> Toast messages to explain why edits weren’t saved post submission
> Early A/B testing on UI elements (e.g. summary layout, pop-ups)


🎬 Phase 2: Thudarum (April 2025)
> Included all updates based on Phase 1 feedback
> New "History" section added for reviewing past entries
> Reps now trusted the system and relied on it as part of their workflow
Reported outcomes:
> Improved accuracy and confidence
> Fewer errors and better traceability
> App data consistently matched manual records, boosted trust
✨WHAT I LEARNT
This was my first real-world project where I saw my designs come to life and be used by actual people, which made the process incredibly meaningful. I learned that great design doesn’t happen in isolation; it requires working with users, not just designing for them. I also realized how important it is to stay flexible, not getting too attached to first ideas and being open to continuous feedback.
Collaborating closely with developers gave me a deeper appreciation for how technical constraints shape design decisions. More than anything, this project taught me how to balance user needs with real world limitations, and that’s something I’ll carry into every project going forward.